OpenStreetMap Part 1: Leveraging open source data for development work
Introduction
Open-source tools for development work allows for the power of big data, machine learning and AI to come together to benefit people who may need it most.
Open source tools are those with publicly available source code that can be downloaded or changed entirely free of charge.
There is a wide range of open-source tools available these days: for instance, this blog is entirely written in the R programming language, free and open source. Other tools include Python, a top-rated data science tool. Open source tools extend beyond programming languages. Some platforms provide access to big, open data sets that can be freely used. A fantastic example of an available data tool that can be useful in development work is the OpenStreetMap (OSM).
According to the OpenStreetMap website, “OpenStreetMap is a map of the world, created by people like you and free to use under an open license.”
Basically, the OSM is an open map in that regular people help identify infrastructure and other map objects for use in the map’s database. The OSM and its data can be accessed through an API, meaning that data can be pulled directly into R or other applications. The amount of handy data one can draw from the OSM is a fantastic asset to data science in a development context.
Take a look at these resources for some more information:
Getting data
It’s straight forward to pull in data from the OSM for use in R with the osmdata by Mark Padgham, Bob Rudis, Robin Lovelace and Maëlle Salmon. The osmar package by Thomas Schlesinger and Manuel J. A. Eugster provides extra R tools to work with the data.
Approach
In general, places with high civic engagement levels do better in successfully completing community development projects. Knowing this, let’s take a look at concentrations of community development centres across Scotland.
Analysis
Our analysis will centre on getting the features we are interested in, plotting them within context, and perhaps adding more relevant features to help bring out any emerging data narratives. First, we’ll need to load our libraries.
Libraries
First, we need to load our packages. We’re going to be working with spatial data, so we’ll load the sf package for that along with standard tidyverse packages for analysis.
library(tidyverse)
library(osmdata)
library(sf)
library(janitor)
Features
We are interested in community development centres within Scotland, specifically within the rural areas of the country. We can see all the available features using the available_features function. Each feature comes with a subset of tags, which are more specific places.
Expanding to the islands
We’ll use a looping approach to replicate the analysis for four islands and one area with a large island population (Argyll and Bute). Here is a list of the key places we are going to look at:
- Argyll and Bute
- Shetland Islands
- Outer Hebrides
- Orkney
An efficient workflow
Getting an efficient workflow is critical to many data science projects. Workflows that aren’t efficient can cause unneeded delays in projects and are often the cause of underlying stress on the job. Knowing this, a good workflow for this type of project (mapping community development amenities) is to:
Identify the key geographic place boundaries that you want to work within and store them in a vector.
Loop over the place vector to pull in the amenity data, then store this in a list.
Loop over the place vector and pull in the boundary data and store this in a list.
Our workflow keeps everything stored lists of the same geographic order.
This will make sense as we work our way through the project, as we will do most of our operations using loops.
In R, looping is typically done with the apply family of functions.
However, I opt to use purrr’s version of the apply functions called map.
I’d highly recommend using functional programming and the apply/purrr workflow as it allows you to utilise the full power of iterative programming!
Community centres
Data can be pulled directly from OpenStreetMap in R using only a few lines of code. The code below does the following:
getbb(.x)- gets a bounding box around a region identified in a stringopq()- builds the query to the Overpass APIadd_osm_feature()- adds a feature to your Overpass APIosmdata_sf()- turns the query into a simple features (sf) object.
The add_osm_feature is where we specify the amenity that we want.
There are many, many different amenities that you can access with R and osmdata. I’d recommend that you have a look at the tags/features documentation to better understand how you can structure queries to access different information – it’s extremely powerful.
We are interested in community centres, so we specify the key as amenity and the value as community_centre.
## get a geographical box that contains
## Scottish islands
scottish_places <-
  c(
  "argyll and bute",
  "shetland",
  "outer hebrides",
  "orkney"
  )


scottish_places_ls <-
  scottish_places %>%
  map(~{
    getbb(.x) %>%
    opq() %>%
    add_osm_feature(
          key = "amenity",
          value = "community_centre") %>%
       osmdata_sf()
  }) %>%
  set_names(
    make_clean_names(
        scottish_places
        )
  )

scottish_places_ls <- map(1:4, ~{
scottish_places_ls[[.x]][[6]] %>%
  group_by(osm_id) %>%
  st_centroid() %>%
    ungroup()
}) %>%
  set_names(
    make_clean_names(
      scottish_places
    )
  )
Place boundaries
Now we need to grab the boundary data for these places. Boundary data can be challenging to identify because places can sometimes go by many different names with spelling differences. This seems to be a common occurrence when using geographic data and is likely the thinking behind things like FIPS codes in the US and other identification indices. OpenStreetMap has unique id numbers that we can take advantage of as well. Take a look at the search function for OpenStreetMap search function for more information.
Once you’ve identified your geographical boundary of interest and spotted its ID number, the opq_osm_id function can be used to access the data from the Overpass API.
We’re interested in the multipolygon data for the boundaries, so we’ll using a loop and some base indexing to pull that information out specifically – we get a lot back from the original API request.
place_id <- c (
  1775685,
  376677,
  1959008,
  3067412
  )

place_name <- c(
  "argyll_and_bute",
  "shetland",
  "outer_hebrides",
  "orkney"
  )


names(place_id) <- place_name

place_boundaries_ls <-
map(place_id, ~{
opq_osm_id(
  type = "relation",
  id = .x
  ) %>%
    opq_string() %>%
    osmdata_sf()
})


place_boundaries_ls <- map(1:4, ~{
 place_boundaries_ls[[.x]][[8]]
}) %>%
  set_names(
    names(
      place_boundaries_ls
    )
  )
Feature cleaning - intersecting points
The last thing we need to do is clean up those points that fall outside of the boundary line.
This happens because we pull the community centre data by using a bounding box.
Bounding boxes are, of course, square in shape.
So we usually get data points that fall outside the area of interest – which is usually not a square!
The st_join with an intersecting join (st_join) can help us shave off those extra points.
## make the two geographies the same
## coordinate projection
scottish_places_ls <-
map2(scottish_places_ls,
     place_boundaries_ls,
~{
  st_transform(.x, crs = st_crs(.y))
})

# find the points that intersect
# with out boundaries data
scottish_places_ls <-
map2(scottish_places_ls,
     place_boundaries_ls,
~{
  st_join(.x, .y, join = st_intersects)
})
Results
We’ve got more plans to do with the osmdata package in R – mainly using it to do some network analysis using the road network.
So, we aren’t going to go into too much detail to create visuals, as we’ll do that in a later blog post.
For now, let’s create a decent looking (but not really publication quality) map of our results to help us spot check and problems. Later, we’ll pick it up and push forward with linking our data to the Scottish road network and creating some fantastic network diagrams of places in Scotland.
Visualising the results
FoWe’llreate a simple ggplot map for our visual, which is pretty straightforward since we’re using sf objects.
We’ll just look at Argyll and Bute community centres.
Remember to look out for Part 2 of this series in the future, using osmdata and the Scottish road network to do some network mapping.
ggplot() +
  geom_sf(
    data = place_boundaries_ls$orkney,
    fill = "#73b896"
    ) +
  geom_sf(
    data = scottish_places_ls$orkney
    ) +
  geom_sf_text(
    data = scottish_places_ls$orkney,
    aes(label = str_wrap(name.x, 35)),
    size = 3,
    nudge_x = .0125,
    nudge_y = .0125,
  ) +
  theme_minimal() +
  theme(panel.background =
          element_rect(fill = "#b2bee0")) +
  coord_sf() +
  labs(title = "Orkney",
       subtitle = "Community Development Centres",
       caption = "Made with OpenStreetMap",
       x = NULL,
       y = NULL)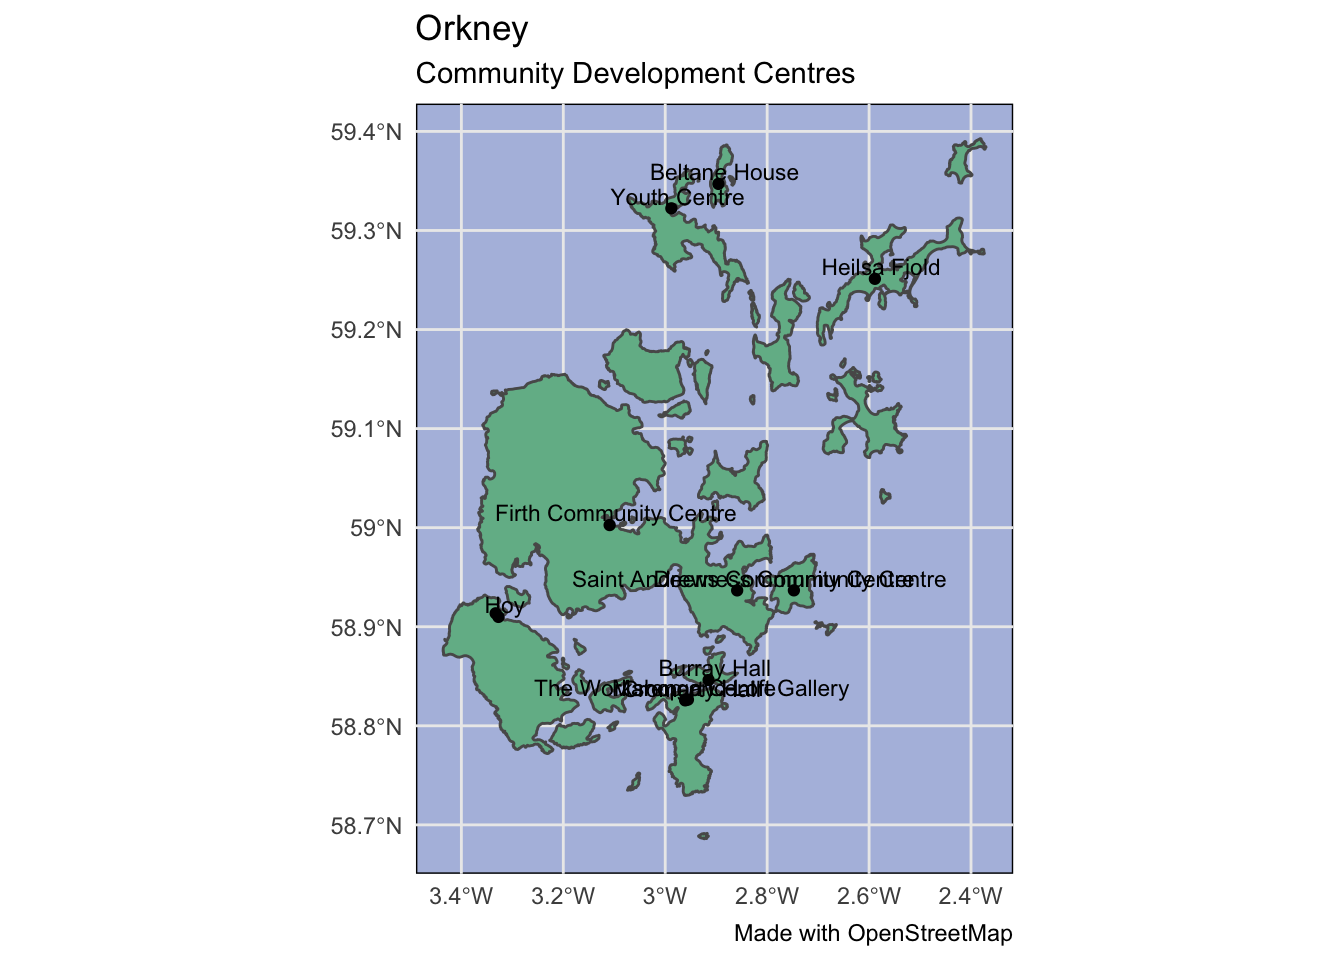
Elliot Meador PhD
Research Fellow
My research interests include community resilience, sustainable food systems and computational social science.